How to Use Studio 5000 Trends for Real-Time PLC Diagnosis
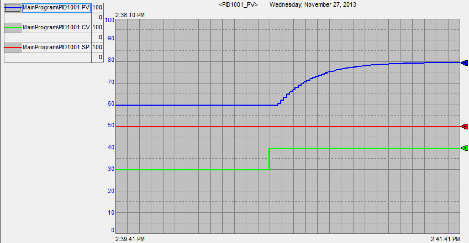
What is my process doing? The operator says during this operation the levels are not controlling at the setpoint…
Facing mysterious PLC control issuesTest in your automation system? Studio 5000 Trends PLC diagnosis tools can help you troubleshoot in real-time by graphing tag values over time. This powerful feature in Allen Bradley’s Studio 5000 lets you monitor up to eight tags at once, making it easier to spot issues like erratic signals or timing errors. Here’s how to use Trends in five simple steps.
Why Trends Are Essential for PLC Diagnosis
Trends in Studio 5000 act like a software oscilloscope, plotting tag data on a graph for real-time analysis. They’re perfect for diagnosing issues in PLC-controlled systems, such as unexpected motor stops or sensor failures, saving hours of manual debugging.
5 Steps to Set Up Trends in Studio 5000
Go Online with Your Controller: Ensure you’re connected to an Allen Bradley PLC via Studio 5000 (Trends don’t work offline).
Create a New Trend: Right-click the “Trends” folder in the Controller Organizer and select “New Trend.” Name it and set a sample period (e.g., 100 ms).
Select Tags to Monitor: Add up to eight tags (e.g., motor speed, pressure) in the “Pens” tab of Chart Properties. Choose tags relevant to your issue.
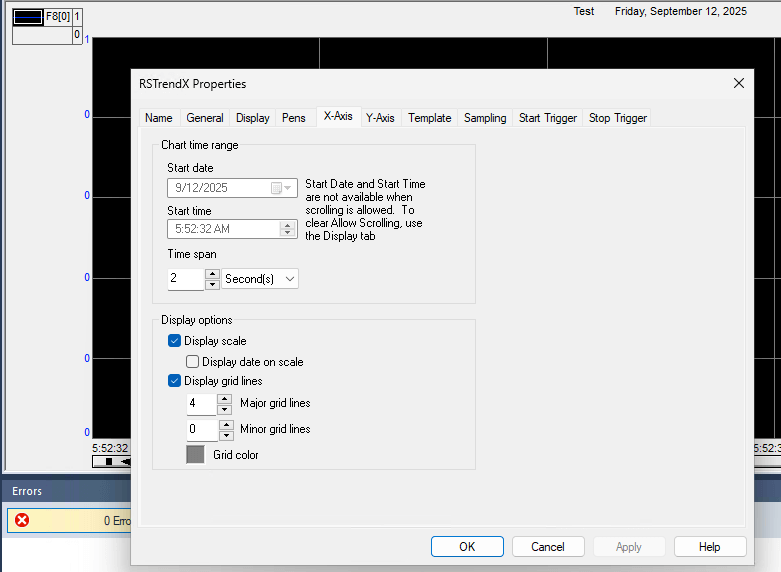
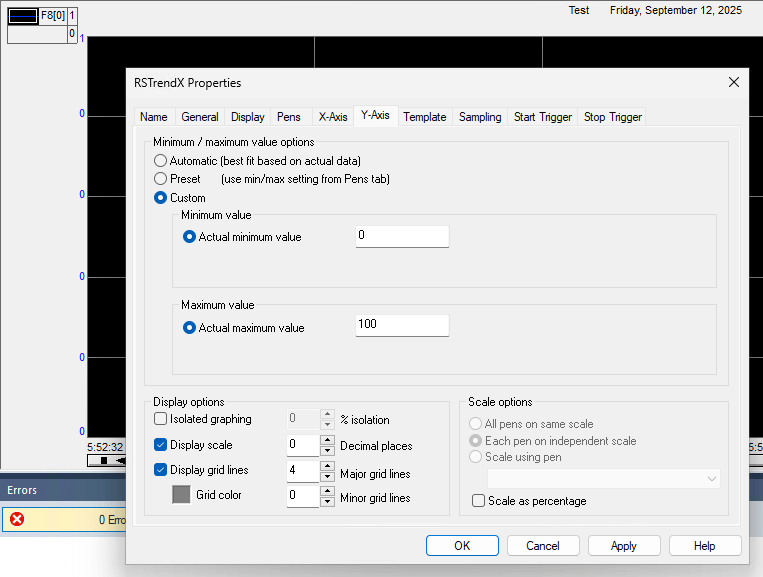
Configure Chart Settings: Right-click the Trend window, select “Chart Properties,” and adjust the X-axis (time span, e.g., 2 minutes) and Y-axis (value range, e.g., 0–100). Disable auto-scaling for clarity.
Run and Analyze: Click the “Run” button to start plotting. Watch for anomalies like spikes or drops, and use the value bar to check specific data points.
Ready to Diagnose Faster?
Using Studio 5000 Trends for real-time PLC diagnosis simplifies troubleshooting and boosts uptime. Start monitoring your tags today! Need help setting up Trends?
In our last project, schedule and quality were very good.�? Also, the coordination and help during installation was good.
Metro Sewer District
David, Senior Electrical Engineer
Would Recommend to Anyone
As far as the internal wiring of the enclosures, I did not find a single wiring error.�? That is very impressive considering the number of enclosures we ordered. I want to thank everyone for the great work.
Brewing Company
Steve, Project Manager
Excellent Customer Support
I receieved excellent customer support, and quickly. Thank you so much!
Oil and Gas
John Herman, Controls Engineer
Great Product.
We needed a simple, easy-to-install chemical addition and mixing control system. Started up without an issue. Our operators seem pleased with the outcome!